13
May 21

Update: Companion Pi Touchscreen

My original post on the Companion Pi Touchscreen was written not long after being pleased at the results of getting it to work well enough to use in production situations.

I followed that up with the addition of a script to monitor the temperature of the Pi.

I thought it might be worth an update after a number of additions to the way I run the companion Pi software on this device, and some peripherals.

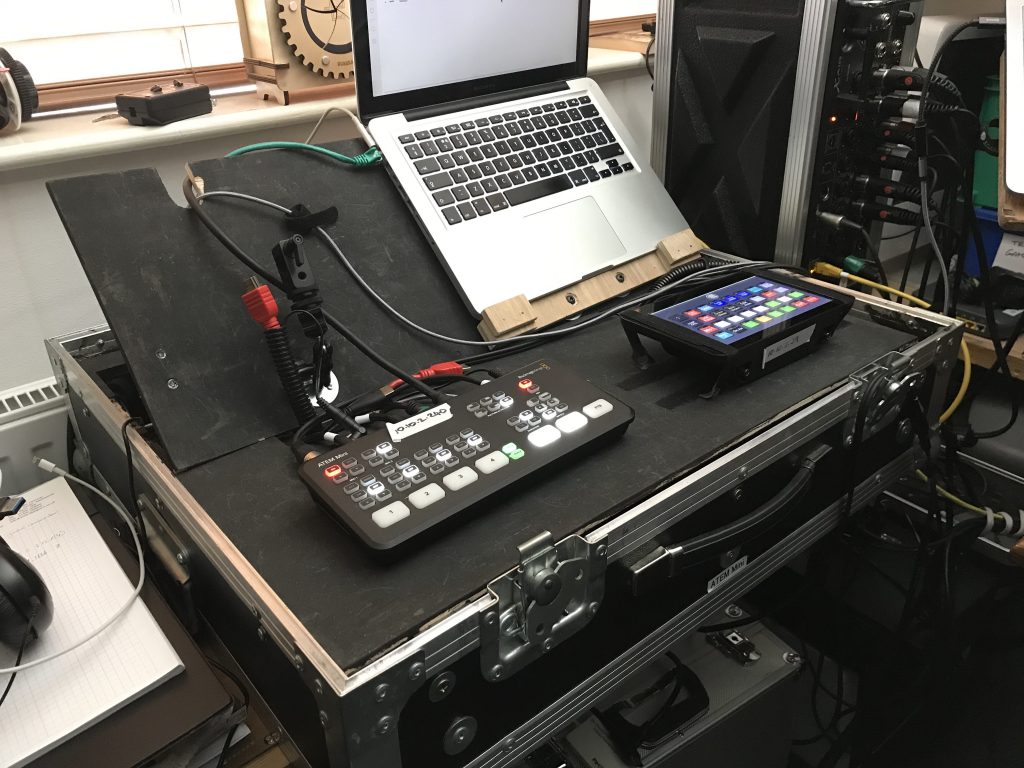
The Companion Pi Strapped in to the FlyPack case (An inverted mixer case with custom tray)

Streamdeck XL

After saving up, I now own a Streamdeck XL. I found that I still craved physical buttons that I could find without having to look at the device. It is plugged in to the USB port of the companion Pi and is running through a 10 meter active USB cable which boosts the signal for a long cable run. I don’t really need 10 meters, but I did want a bit more flexibility for being able to site the Streamdeck on a trolley that carries our main presenter computer.

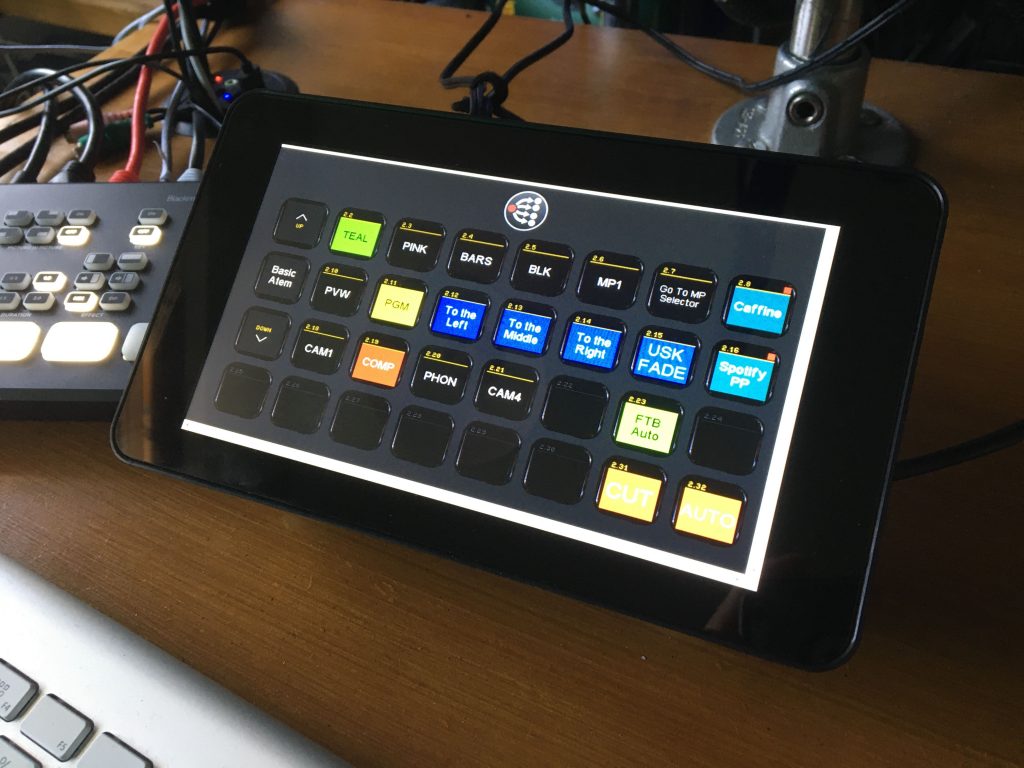
The Streamdeck is powered by the Pi, and is configured in companion as a separate instance so the touch screen and streamdeck can show different button pages. I now mostly have the Pi touch screen showing a diagnostic page of buttons allowing me to see at a glance that everything is connected and running OK.

DMX host

The Pi also acts as a DMX host, running an Open Lighting Architecture host that allows me to control an Enttec DMX Pro MkII via artnet.

This allows me to use companion Pi as well as other software to control some DMX enabled lighting over the network.

Second screen

The Pi also has a second screen attached and with the aid of some custom scripts can play youtube clips at the touch of a button. I use this for some animated backgrounds for zoom calls where the Atem controls the greenscreen.

I do have one problem with the second screen… when it is attached it halts the boot of the pi until it is detached. So I don’t have it atached now until after booting it, which is not ideal. Hopefully I will find an answer at some point.

But why is the Pi doing all these things?

The Pi is now part of a ‘flypack’ which acts as a portable hub for my increasingly complex puppet shows! I want to be able to control everything from a single point – which is often behind a puppet theatre curtain, and with the aid of companion, qlab and DMX, we can put on quite a nice show. Or we will be able to once we can get out of the house again after lockdown.

I’ll write more about the flypack and it’s design in a future post.


03
Sep 20

RPi Temperature Monitor

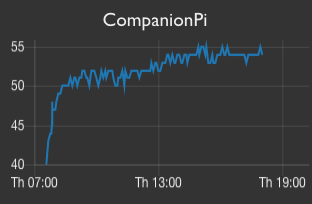
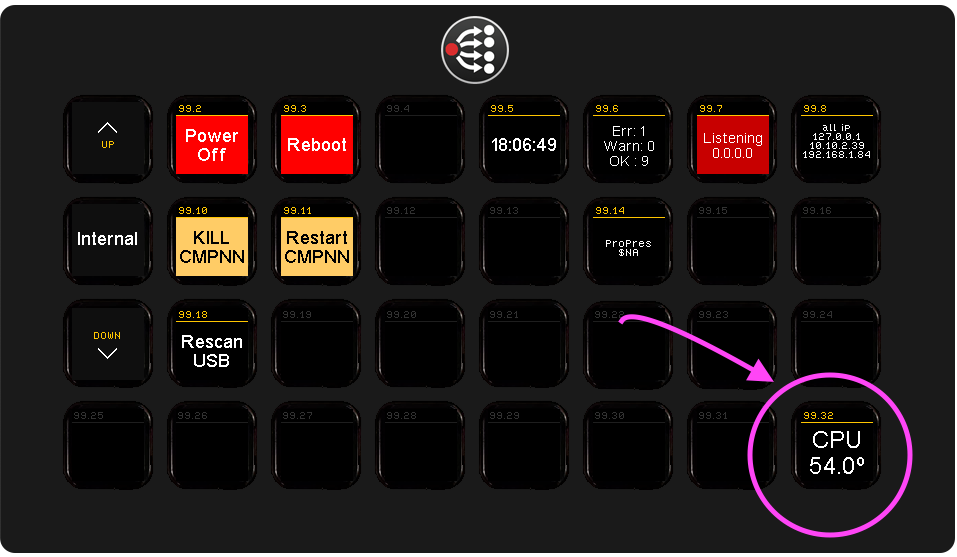
I wanted a way to track temperature changes on my Raspberry Pis, especially the one that was acting as a Touch Screen for my Bitfocus Companion host. It is in a small case, and I had recently installed a heatsink and fan to aid with heat disipation and so wanted to see how much of a difference it made over time. (Spoiler: The cooling is keeping the cpu core about 20ºC less than it would have been without it!)

The button as it appears on the stream deck

I already had Node Red in my network which is monitroing all sorts of things including temperature sensors, and it does this in tandem with an MQTT broker. So all I needed to be able to monitor my Raspberry Pis temperature and have it display anywhere I wanted, was to send the temperature value to MQTT and then have various clients subscribe to it.

I adapted a small python script from thingsmatic which I am using to monitor the CPU temperature on two of my suit of RPis. I say adapted – I just had to make sure I was using the full path for all executables used by the script and also make sure that the python module for sending the MQTT message was installed.

CPU Temperature over time, from a cold start, with heatsink and fans.

Architecturally it looks like this:

  • The Raspberry Pi runs a script via the cron. I am monitoring every 5 mins.
  • The script calls the vcgencmd to get the temperature and publishes this to an MQTT broker on the network.
  • Node Red is subscribing to the topic and adds updates to a line chart in the dashboard as they arrive.
  • Bitfocus Companion has an MQTT plugin which means I can subscribe to the topic that will contain the CPU temperature and update a variable when that value is seen on the network. I also added an action to the buton that would run the temperature check script on the Pi at an arbitrary point.

Main disavantages are that this solution will not work when I leave my home network. But it’s rare that I do that anyway these days!!


21
Jul 20

Google Meet Mute with Stream Deck and Companion

I recently found Bitfocus Companion and it has done nothing but provide inspiration for new ideas for buttons to control things which normally I’d have to faff with a mouse to control.

Google Meet is our video platform of choice at work, and I was fed up with loosing the window and not being able to unmute myself quickly when someone asked a question in the middle of my presentation or meeting.

So a button on the Stream Deck XL is required to alleviate this dreer.

Overview:

I’ve used Better Touch Tool for ages to provide an interface for controlling my mac from a phone or tablet when projecting films on the wall, and used its screen snapping features for years to arrange program windows quickly in multi screen workflows.

But now it was the turn of BTT to provide the tooling to programme a series of actions that would find a google meet window running the video call, switch to it, and send the ‘mute’ toggle keyboard shortcut. There is a preset you can download at the end of this post for a named trigger.

No matter which of your browser windows is hiding the Google Meet window amongst a million other tabs, we’ll find it and bring it front and focussed… and unmuted.

Working back up the signal chain… BTT comes with a webserver which can be enabled to listen to triggers on an HTTP port. You can copy the HTTP request for each trigger in the BTT admin, and you’ll paste that in the Companion config.

Companion has a generic HTTP plugin which can trigger BTT on the target machine. Simply paste your trigger URL in a new button using the http instance on the key down, and jobs a goodun.

Download the BTT preset here.


25
Apr 20

Companion Pi Touch Screen

Bitfocus Companion is an awesome way to make buttons on a keyboard device control other software or hardware. My interest in this is because we run church services with very minimal staff. Usually the one person on the sound desk is the same person operating ProPresenter.

We are a small church which has to setup and teardown each week, and I’ve currently got our setup down to three wheeled units to roll out, and three cables to plug in for all sound and vision. More about that and the desk I built to hold it all in the future, because right now we are doing everything from home.

Today is all about using Companion to activate a video switcher and handle running shortcuts in zoom and ProPresenter.

Basic overview

Installation steps.

I have linked to key documents were necessary. Some of these things are easy to find out with a quick google search, and they don’t have links, but the description should be enough to get you there.

  • Attach all the hardware together, but don’t put it in the case yet.
    • I used a separate power supply for the pi and touch screen.
  • Write the Companion Pi image to a micro SD card.
  • Insert the SD card and boot it all up.
  • Then used sudo raspi-config to Change timezone back to Europe/London (clearly this is an optional step, but I do like my time to show correctly on my companion buttons!!)
  • Added the following to the /boot/config.txt file lcd_display=2 This will rotate the touch screen display 180 degrees so that it is oriented correctly for the case.
  • Then installed chromium-browser and set it to run in kiosk mode. I followed the excellent instructions from desertbot.io, but my first step in those instructions was already completed as I had the companion pi image installed and running.
  • For your Kiosk URL use http://localhost:8000/emulator and this will launch the emulator every time the ‘kiosk’ launches.
  • And that’s it, you should have the touch screen ready to use with the companion 32 button emulator.
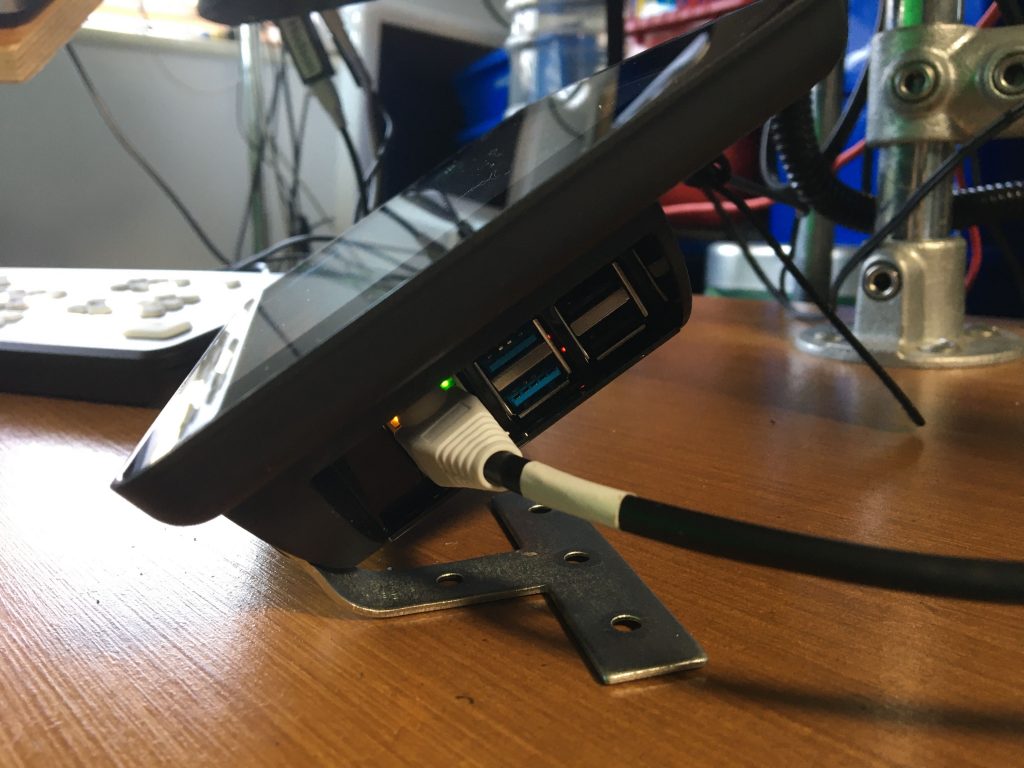
  • Finally I made some little feet to hold the screen at the right angle. Some T brackets bent to the right angle did the job here, and a couple of found screws that happened to be the right size to fit the holes in the case.

Things to to

  • Screen size. the emulator page is just a little to wide and long for my liking, as this causes scroll bars to be visible. I can’t seem to find a way to get rid of these without altering the emulator page code in companion pi, and I didn’t want to go faffing with the companion code.
    • Update: I’m currently using this command line after some helpful comments and emails from others who have had a go building a similar box. chromium-browser --noerrdialogs --disable-infobars --kiosk $KIOSK_URL --force-device-scale-factor=0.88 --enable-features=OverlayScrollbar,OverlayScrollbarFlashAfterAnyScrollUpdate,OverlayScrollbarFlashWhenMouseEnter
  • Boot up seems patchy, sometimes it’s fine and sometimes I get a flashing activity light on the pi which sugests that it couldn’t read a file from the SD card. I suspect the SD card is flaky, so might try another one, but don’t have one spare at the moment…
    • A new faster SD card did the trick.


03
Dec 19

Create directories for months of year

I wanted a way to quickly create directories for each month of the year. I wanted them named using a human readable name, but with a sort order that kept them in month order.

Using bash 4 and a pretty standard time formatting command gives us the command you can see in the gist


18
Apr 19

Giving and taking criticism

With love.

That’s the high level summary, but what does that mean in practice? And how did I get to that conclusion anyway?

In my first arts degree we had regular ‘crits’ at the end of each project brief. We’d lay out our wares in the corridor, supporting work and final pieces, and our work was marked by the lecturers. After the marking we’d all congregate in the corridor, and watch as each student was either pulled to shreds or had their ego massaged. Whether this was a good or bad thing was always highly subjective and ALWAYS resulted in several students going back to their workspaces in near-tears.

As a result I spent 3 years of my life learning that there was a good way to criticise someone, and some very nasty bad ways. I would often find myself as being one of the people who would go and offer support to those who had been torn to shreds. Sometimes I agreed with the criticism, but not how it was delivered, and sometimes I also did not agree with the criticism, and felt it was my duty to give a different perspective.

  1. Everyone needs encouragement. If you cannot find anything encouraging to say then you are not qualified to give criticism. Why? because encouragement is the thing that motivates the person being criticised to take action, and without encouragement, you simply demotivate and demoralise them.
  2. Accept that everyone makes mistakes. If you are the giver, this means you have to remember that this could so easily be you and deliver it humbly and preferably with real examples of where you encountered a similar situation and how you dealt with it. If you are the taker, you need to get to a point where you realise that the person giving you the criticism is trying to help you shortcut a learning they made before.
  3. Be constructive. If something needs to change, and you can see why, but someone else can’t, then you have to help them see why the criticism you are delivering is necessary. This might be by explaining how it is having an impact and give them a way to resolve it for themselves.
  4. Let them take control. With the best will in the world, it is rare that you can help someone who does not want to be helped. Often people get to a point where they feel like they have lost control and that there is no point to what they are doing. So be clear that they are free to ignore your advice and make their own decisions, and that you will support them in that as best you can.
  5. With love. When you love someone you want the best for them. You want to see them grow, to flourish, to bloom. You want to see them achieving their dreams and being the most amazing person they can be.

If everyone gave criticism with love we’d all have a much better time taking it. We’d be able to move on more quickly and have the input we need to work stuff out for ourselves.

If everyone took criticism with love, or looked for the love in the criticism, we’d know that the other person was doing their best to use their life experiences to help us. If we can’t see the love in the criticism then we shouldn’t take it on board without evaluating it carefully, as it may be meant to hurt us or hold us back.

It’s not easy.


24
Oct 15

Raspberry Pi as a Door Maid

DVR_Webcam_-_Dropbox_EditionI regularly work from home, and because there has been a great deal of house renovation to be done there are plenty of deliveries to be waiting in for. I work at the back of the house, and being such a solidly built house with blockwork walls throughout – no plasterboard stud walls here – it’s hard to hear people knock at the front door. Also the door bell doesn’t work.

Before I hear you say – why don’t you fix the door bell – well we are in the middle of doing that bit and the rewiring hasn’t happened yet – and the wireless battery powered door bell has been as useful as a chocolate teapot.

So as I had the parts to hand here’s what happened…

The cameraParts:

  • 1 usb webcam
  • 1 raspberry pi
  • 1 wireless usb dongle (or you can plug in to your network using a network cable)
  • 1 usb powered hub
  • a power brick to power the hub
  • Another to power the pi
  • Another device to use as the door maid – I have used several…

Assembly:

  • Plug the usb webcam and wireless dongle into the hub.
  • plug the hub into the raspberry pi.
  • plug the power leads into both and switch on.

Rpi and attachmentsI am going to make an assumption that you have already got your raspberry pi bootable with the Raspbian operating system, and that you have already got your wireless dongle connected to your wireless network. There are plenty of guides ‘out there’ to take a look at to get you to the point that you have a bootable and workable raspberry pi that is networked.

Location:

Put the webcam somewhere where it has a view of the area outside the front door. (or of course point it any anything else you want to be able to see. You probably want to avoid getting too much sky in your shot – especially when the sun might be passing through the field of view of your webcam.  You also might want to avoid getting a busy road in your webcam’s field of view if you expect to use motion detection – otherwise motion will be detected every time a vehicle goes by!

Software:

I am running some software called motion which is a program that monitors the video signal from cameras. It has a couple of useful features, like motion detection, and the ability to take time-lapse videos. The main one I use is the streaming of the video feed to other devices.

Full details for installing motion and basic setup can be found here: http://pingbin.com/2012/12/raspberry-pi-web-cam-server-motion/

Consuming the feed:


22
Nov 14

Reading Lives – Beyond the book

Explore how reading has impacted people's lives.

Explore how reading has impacted people’s lives.

Over the summer and early autumn I had the opportunity to continue work on the Reading Lives project. The project has grown over the last few years from a discussion at a ‘hack-day’ about a column of data in a survey result-set that nobody knew what to do with, to a web based application that allows people to explore the answers given to the question “What role has reading played in your life?”. The fact that you are reading this now suggests that you too could answer that question, and share a short summary of the role that reading has played in your life.

About the project

The project has become what it is through some funding from the Arts and Humanities Research Council via the CATH (Collaborative Arts Triple Helix) project lead by do.collaboration at the University of Birmingham in partnership with the University of Leicester. CATH consists of several teams, each one of which is made up of a developer, an arts organisation and researchers. Our team consists of researchers Danielle Fuller (University of Birmingham) and DeNel Rehberg Sedo (Mount Saint Vincent University, Canada); myself Tim Hodson (the developer) and Writing West Midlands (the arts organisation).

Reading Lives word cloud at the Birmingham Literature Festival

Reading Lives word cloud at the Birmingham Literature Festival

At the time of writing this, the project is not only allowing people to explore the existing survey answers, but to contribute their own answers. The app presents a user profile which people can fill out with their own survey answers. Recently the app featured at the Birmingham Literature Festival, and was seen on the big screen at several of the events.

About the Data

The Answers as I call them are the answers to the question “What role has reading played in your life?”. Each answer is analysed for it’s word content by using a (relatively) simple algorithm called Term Frequency – Inverse Document Frequency. This algorithm allows me to decide how important a word is in a particular document based on it’s frequency in the Answers and it’s frequency in the corpus of all answers. To quote Wikipedia “The tf-idf value increases proportionally to the number of times a word appears in the document, but is offset by the frequency of the word in the corpus, which helps to control for the fact that some words are generally more common than others.”. This calculated importance of words is used to build a word cloud which is meant to act as an alternative way to explore the frequently occurring themes of peoples Answers. We also have demographic data for the Answers which was collected through the original survey. It is planned to use this to allow further empathetic connections between the viewer of the app and the original Answers, but we haven’t got to build that bit yet :).

About the app (warning – gets technical!)

As developer to the project I have been exploring several different ways to ‘do something’ with the answers. This exploration has tried out a number of different technologies with a view to finding a happy medium between ease of use and flexibility.  I have also deliberately challenge myself by forcing myself to learn something new. The app is written in HTML, CSS and Javascript, and uses the AngularJS framework to provide the app structure. There is a whole heap of build streamlining provided through use of Node, Bower, Less and Grunt and I’m using Live Reload to enable quick iterations in the browser when developing. For the backend I am using Firebase (an event driven cloud database) which updates when data in my app updates and — with Firebase’s Angular integration — any variables bound in Angular can also be bound to Firebase.  This three way binding means that as soon as a client app updates some data, it is sent back to the cloud — and — sent to any other clients that are also viewing the same bit of data.  Each app client is always kept up to date as soon as the Firebase server is updated. This kind of event driven database makes it really easy to create both a realtime app, and an app which is more tolerant of bad network connections. I chose to store all my assets for the app in Amazon’s Simple Storage Service (S3), so that Firebase and S3 are the only external services the app needs. Everything else runs in your browser. Although there were some late nights to get everything ready for the key events, it has been a lot of fun to build.


18
Apr 14

RPi Sensor Network – Collecting the data

sensors_timhodson_com___

The realtime sensor display live!

In a previous post I talked about how I put together some temperature sensors to log temperature in the green house and lounge. The sensors use XRF radio modules to send the data back to a Raspberry Pi (also sporting an XRF module) and are running from a 3.3v button cell battery.

The XRF module on the Raspberry Pi is sending the messages from the sensors to the RPi’s serial port, and this is where we start to talk about code…

The plan was to build a realtime display of the data from the temperature sensors.  You can now see the live temperature from our green house and lounge, along with a history of readings over the last 1, 12 and 24 hours.

The code I used is available in a public Github repo – but is considered to be ‘alpha’ code – in that it is not tested end to end or from build to deployment. So you use at your own risk and with an assumption that you’ll have to tinker with it to get things running for you.

The steps below give an overview of the architecture, and each of these steps is explained in more detail in the sections which follow. However, this is not intended to be an in-depth how-to guide.

  1. Sensor sends LLAP message to RPi serial port
  2. Python script is listening to the serial port every minute
  3. LLAP Messages from the sensors are parsed into a simple JSON document which is posted to a Firebase database
  4. Firebase is an event driven database where all additions and updates fire events.
  5. An AngularJS app (served from Amazon S3 backed storage) shows the latest readings in a live updating display by listening to those Firebase events.

Sensor Sends LLAP messages to RPi serial port.

This is the easy bit, as the hard work of programming the sensors is already done for you by the Ciseco people.  The sensors send messages using a simple 12 character message system called Lightweight Logical Application Protocol. The actual sensor setup and connection to the RPi is covered in the previous article.

Python script listens to serial port

I wrote a small python module to parse LLAP messages into a simple JSON document which could then be stored or otherwise manipulated as necessary. The module is available as part of the Github repo. The LLAP python module treats every message received as an event, and if you have registered a callback to a particular type of LLAP message, every time that message is received your callback will be notified and whatever your callback does – it will do! The LLAP module simply deals with the parsing of a string of messages captured from a serial port, and passes those messages on to your callbacks. This means that you can react to each temperature reading or battery low message as and when that message arrives.

It is up to your callbacks to decide whether to make a note of the time the message was received, and what action to take based on the message.  But using this method it would be simple to have a temperature change over or under some threshold trigger some action. For example, if it get’s too warm in the green house, a motorised window opener could be triggered to let in some fresh air.

The code which listens to the serial port and registers the callback is up to you to write, but you can see the code in the Github repo which I am using to listen to the sensor messages.

LLAP messages sent as JSON documents to a Firebase database
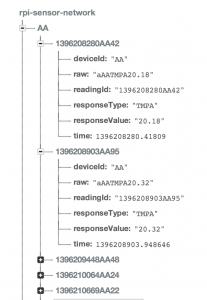
Forge__Firebase_Graphical_Debugger

The readings as seen in the Firebase database.

This is where it starts to get fun!

Firebase is an awesome cloud based database which allows you to post and get data using simple HTTP requests.  Because the database is event driven, and because it already has deep integrations with Angular JS, you can quickly build a responsive, data driven site which instantly responds to many events happening in different browsers all over the web. For our purposes – we want to show a live updating latest temperature displayed in a webpage – this is ideal.

The python code mentioned in the previous section simply takes the parsed LLAP message, adds a timestamp, a priority (used for ordering the result sets in Firebase) and a reading id which is just the timestamp float with the period (.) replaced with the sensor id (you can’t have periods in a Firebase key!). The resulting JSON object is then posted as a reading to the Firebase database.

Firebase is event based and fires events that you can monitor

Every time a new reading is added to the database by the python script, Firebase fires off some events to any other clients which are listening for those events.

This means that we can write a web app which listens to those events and updates it’s display with the new readings.  This essentially means we can have a realtime display of the sensor readings.

So the next step is to build that interface…

AngularJS app to show readings in near realtime

sensors_timhodson_com___In the Github repo, you’ll find the code for an AngularJS app which shows the sensor readings for the sensors in my network.  Now it has to be said that the app has not been written to be generic, and if you decide to fork the repo to build your own, I suspect you’ll have to do a fair bit of ‘hacking’ to get it to work.

The app was an opportunity for me to play with the following tools and what you see here was built in a weekend – just goes to show how useful these tools are.

  • Yeoman – for building the initial angular and firebase app skeleton.
  • Grunt – for automating some of the build and preview.
  • Bower – for managing Javascript dependancies
  • AngularJS – for realtime binding of variables in the HTML to variables which are fed directly from Firebase data.
  • angularFire – for the abstraction of the code needed to actually talk to the Firebase database.
  • Bootstrap 3 for reactive presentational elements to make it work on mobile and desktop.

I don’t pretend that this code is pretty – and there are no proper tests, but it works and it was fun to build!

Apologies

Finally, apologies to all those whom I have bored with recounting the current temperature in the green house!


14
Apr 14

Analyse RIS files

Reference managers like Endnote, Refworks or Zotero often allow you to export your bibliographic citations as a RIS file. You can import these into things like Talis Aspire Reading Lists.

The script below will look in the current directory for RIS files and analyse their contents. We are looking to see what types they have and how many of them have some sort of identifier that can be used to find better bibliographic data from some other source.

#!/bin/bash

while IFS= read -r -d '' file
do
	echo -n "#=== "
	printf '%q\n' "$file"
	egrep "^TY" "$file" | sort | uniq -c 
	typeCount=$(egrep "^TY" "$file" | wc -l)
	snCount=$(egrep "^SN" "$file" | wc -l)
	echo $(($snCount*100/$typeCount))"% of records have an SN ("$snCount" of "$typeCount")"
	echo
done < <(find . \( -name "*.ris" -o -name "*.txt" \) -print0 )

Sample output:

#=== ./PMUP00DNMod3.txt
  17 TY  - CHAP
   4 TY  - JOUR
80% of records have an SN ( 17 of  21)

#=== ./PMUP00DNMod4.txt
  11 TY  - CHAP
  10 TY  - JOUR
95% of records have an SN ( 20 of  21)